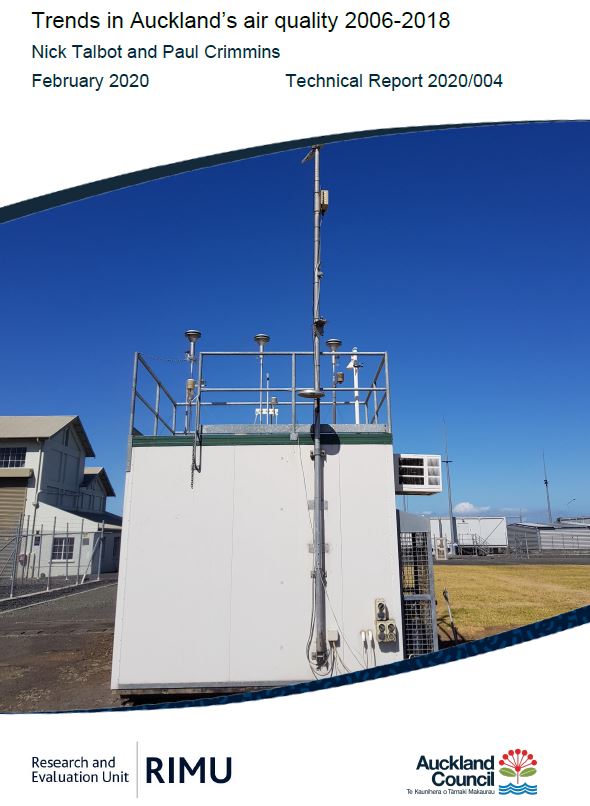
Trends in Auckland’s air quality 2006-2018
Author:
Nick Talbot, Paul CrimminsSource:
Auckland Council Research and Evaluation Unit, RIMUPublication date:
2020Topics:
EnvironmentFrom the Executive summary:
Pollutants in the air cause adverse health effects and reduced visibility. Air pollution in the Auckland region has been monitored by Auckland Council since the late 1990s at representative monitoring sites using high-accuracy equipment in accordance with applicable Australian and New Zealand standards. The purpose of the regional air quality monitoring programme is to ensure that there is good scientific understanding of pollutant levels, trends and sources, in order for Auckland Council to manage air quality. In addition, regional councils have a responsibility to monitor and manage outdoor air quality under the Resource Management Act 1991.
Trends in air pollution across the Auckland air quality network between 2006 and 2018 (inclusive) are reported here. Statistical analysis has been split into two separate time considerations, longterm (2006-2018) and short-term (2013-2018). Seasonal and deseasonalised statistics are provided for both time periods and for all measured variables across the Auckland network. Source apportionment data for fine particulate matter (PM10 and PM2.5) has been included in the analysis where available to identify emission sources.
In most locations, PM10 and PM2.5 had statistically significant decreasing monotonic trends for both short- and long-term timeframes. Queen Street is not following this trend. This city centre site has shown significant increases in PM2.5 and PM10 for the short-term analysis (P<0.001 and P<0.1, respectively). Nitrogen dioxide (NO2) shows marked decreases in concentration over the long-term; however, short-term trends are starting to show increases in concentration at several sites near major roads. Queen Street has shown a statistically significant increase in NO2 since 2013 (P<0.001) and has for the past two years exceeded Auckland’s ambient air quality target for NO2 of 40 μg/m3 per annum.
This report provides an analysis of air quality across Auckland, changes over time, key factors driving the observed patterns and how policy and regulatory responses impact the quality of Auckland’s air. The need for more city centre monitoring is apparent to further investigate recently increasing trends.
Auckland Council technical report, TR2020/004
February 2020
See also
