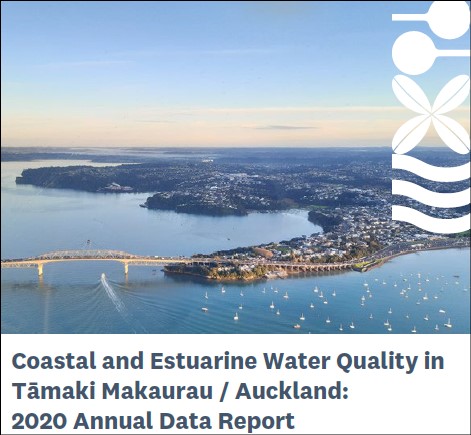
Coastal and estuarine water quality in Tāmaki Makaurau/ Auckland: 2020 annual data report. Datasheet
Author:
Rhian Ingley, Jane GroomSource:
Auckland Council Research and Evaluation Unit, RIMUPublication date:
2022Topics:
EnvironmentDatasheet for Coastal and estuarine water quality in Tāmaki Makaurau / Auckland: 2020 annual data report
Executive summary
Auckland Council monitors the state of the environment in the region as required under section 35 of the Resource Management Act 1991 (as amended, RMA). Auckland Council operates a long-term, region-wide coastal and estuarine water quality monitoring programme. The programme includes 31 sites, representative of Auckland’s three main harbours (Kaipara, Waitematā and Manukau) and the east coast of the Hauraki Gulf, including the Tāmaki Estuary, and Mahurangi Harbour.
This annual report summarises the results for 16 water quality variables collected monthly during 2020. These include measures of nutrient enrichment, sediment and water clarity, and other physical variables. This programme does not include indicators of faecal pollution which is managed through Safeswim. 2020 was the driest year in Auckland on record and these annual water quality results are therefore representative of lower river flow conditions (and associated freshwater discharge to the coast).
This annual report provides an overview of the state of water quality using a regional Water Quality Index. The index compares values recorded over the period of 2018-2020 to regional guidelines for six core parameters. Scores range from zero (worst) to one hundred (best) and are divided into five classes from ‘poor’ to ‘excellent’.
Nearly 60 per cent of sites assessed had ‘good’ to ‘fair’ water quality. Water quality class generally follows a spatial gradient in freshwater influence from ‘poor’ in the upper tidal creeks to ‘good’ at harbour mouths and along the coast.
- All sites along the East Coast and within the Mahurangi Harbour were within the ‘good’ water quality class except for Browns Bay which was ‘fair’.
- Water quality in the Waitematā Harbour ranged from ‘poor’ in the upper tidal creeks, to ‘fair’ along the main channel from Hobsonville towards the Harbour Bridge.
- Water quality improved from the mid reaches of Tāmaki Estuary towards the lower channel near Half Moon Bay marina from ‘marginal’ to ‘fair’.
- Water quality was classed as ‘poor’ at five of the eight monitored sites within the Manukau Harbour and improved to ‘good’ at the harbour mouth. Water quality at these five sites was ‘poor’ due to elevated nutrients, chlorophyll a (algae) and turbidity (suspended particles affecting water clarity) compared to regional reference values.
- Water quality ranged from ‘poor’ at the southern end of the Kaipara Harbour near the Kaipara River mouth and improved to ‘fair’ at Shelly Beach up the south Kaipara channel. Water quality also improved from ‘fair’ to ‘good’ along the Tauhoa Channel from the Hoteo River towards the mouth of the harbour.
Changes in water quality index scores over time can provide an indication of large-scale changes in water quality. The regional distribution of water quality index class has been largely consistent over the past four assessment periods considered here (2014-2016 to 2018-2020). Most site-specific changes in index class over this time frame were considered likely to be associated with analytical and sampling variability, and climatic variation. Long-term trend analysis was recently completed for the 2010 to 2019 period and this previous report should be referred to for further information on changing water quality over time (Ingley, 2021).
Auckland Council technical report, TR2022/20. Datasheet
See also
Coastal and estuarine water quality in Tāmaki Makaurau / Auckland: 2020 annual data report
