Auckland economic update September 2023
Author:
Ross WilsonSource:
Auckland Council Research and Evaluation Unit, RIMUPublication date:
2023Topics:
EconomyAn overview of the Auckland economy for September 2023, in charts and graphs and with some commentary.
Highlights this month include:
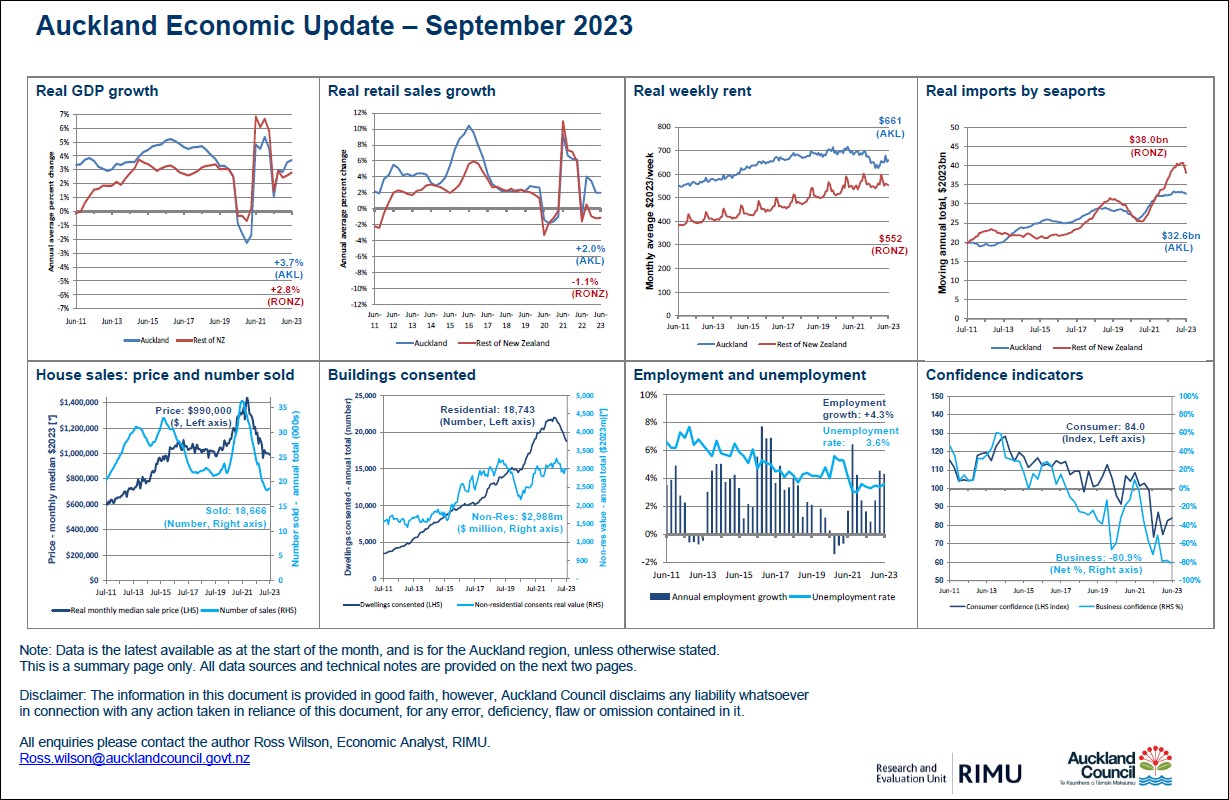
- real* rate of GDP growth was 3.7% for the year ended June 2023 compared to the year ended June 2022 – slightly above the 12-year average growth rate;
- real* rate of retail sales growth was 2.0% for the year ended June 2023 compared to the year ended June 2022 - similar to the two years before Covid;
- average weekly rent for May 2023 was $661 (2.0% higher in real* dollars than June 2022, but still slightly lower than five years ago, but 5.5% higher than November 2022 dip);
- real* value of imports by seaports for the year ended July 2023 was $32.6 billion, which was 1.2% higher than the year ended July 2022; Auckland’s robust post-Covid growth slowed from 2022;
- number of houses sold for the year ended July 2023 was 18,666, which was 23% lower than a year prior, but similar to recent months (so no longer falling);
- median house price for the month of July 2023 was $990,000, which in real* dollars was: 14% lower than a year prior; 32% below the 2021 peak; similar to 2016, and similar to recent months;
- number of dwellings consented in the year ended July 2023 was 18,743 (14% lower than year ended July 2022, continuing the downtrend since September 2022);
- non-residential consent value in the year ended July 2023 was $2,988 million in real* dollars (only 5% lower than year ended July 2022, and broadly similar to most of May 2021 onwards);
- number of people employed was 4.3% higher in the quarter (not year) ended June 2023 than in June 2022 quarter, due to both population growth and record-high labour force participation rate;
- unemployment rate in the quarter ended June 2022 was 3.6%, slightly above the September 2022 trough, but still the second-lowest June quarter since 2007;
- measures covered: business and consumer confidence, GDP, imports, retail sales, employment and unemployment, house prices and numbers sold, weekly rents, building consents.
*Note: real dollars are after adjusting for the effects of inflation each quarter.
September 2023
Previous 2023 updates. There is no January 2023 update.
Selected 2022 updates