Auckland economic update October 2024
Author:
Ross WilsonSource:
Auckland Council Social and Economic Research and Evaluation TeamPublication date:
2024Topics:
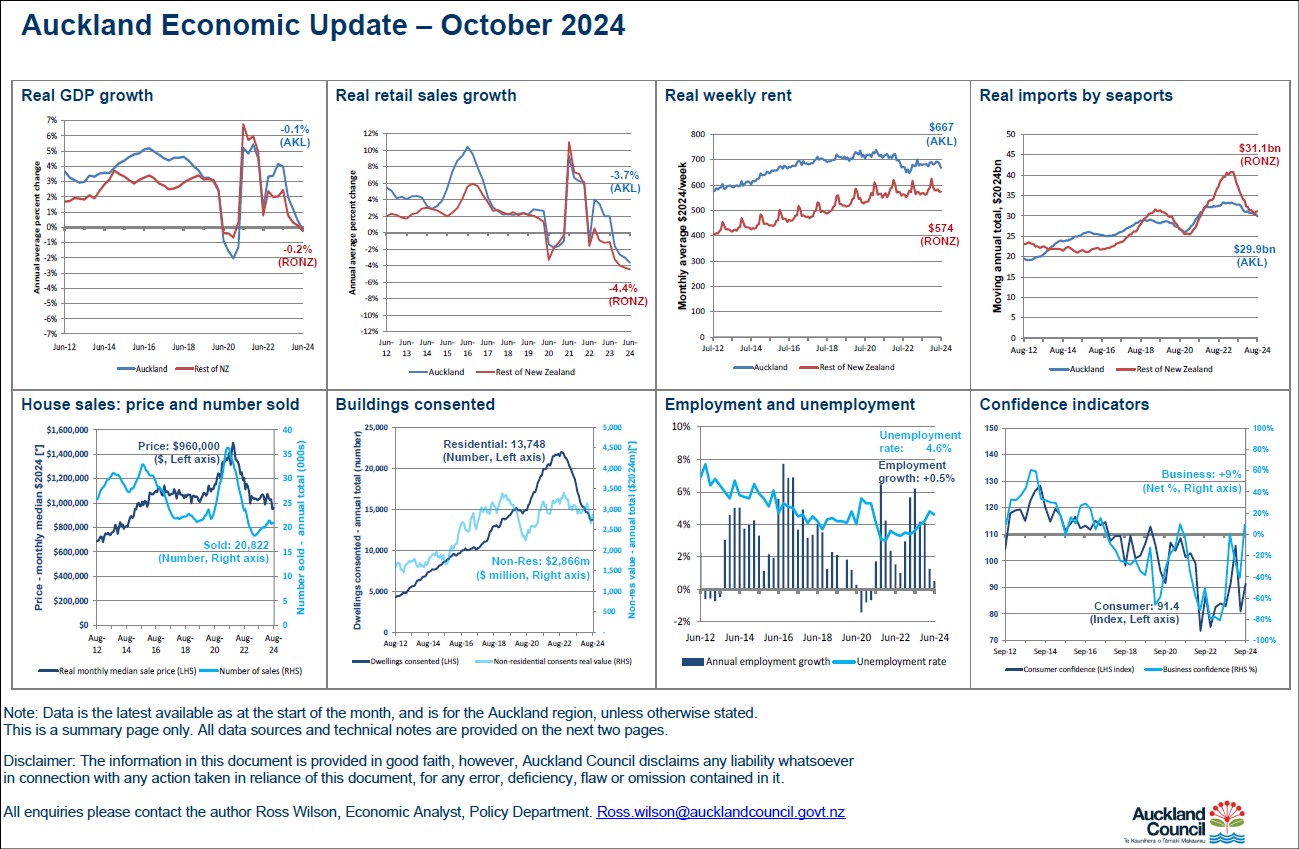
EconomyAn overview of the Auckland economy for October 2024, in charts and graphs and with some commentary.
Measures covered: house prices and numbers sold, weekly rents, building consents, employment and unemployment, GDP, business and consumer confidence, retail sales, imports.
Highlights include:
- business confidence (NZIER QSBO) for the September 2024 quarter showed a net 9% of businesses expecting the general business situation to improve over the next three months – the highest-equal quarter (and one of only two positives) since 2017, but below most of 2012 -2017 (all positives except one). ;
- real* value of imports by seaports for the year ended August 2024 was $29.9 billion, which was 9% lower than the year ended August 2023, but 6% higher than 5 years ago. For the rest of New Zealand, the figure was $31.1 billion (16% lower than a year ago, and the same as 5 years ago);
- average weekly rent for the month of July 2024 was $667 (2% below a year ago; below late 2016 to mid-2022). For the rest of New Zealand, the figure was $574 (similar to July 2023, following three years of minimal growth, after January 2021);
- number of houses sold for the year ended August 2024 was 20,822 (similar to the last several months; 14% above May 2023’s trough; 43% below July 2021 peak; below all of 2012-2022);
- median house price for the month of August 2024 was $960,000 (13% below eight years ago (2016) in real* dollars; 7% lower than a year ago; slightly below most of the last 18 months; 36% below the 2021 peak);
- number of new dwellings consented in the year ended August 2024 was 13,748 (37% lower than the September 2022 peak; 1% higher than for July 2024, and the first rise since the 2022 peak; similar to 2019);
- real* value of new non-residential buildings consented in the year ended August 2024 was $2,866 million (8% above the year ended July 2024; below most of the last three years, and 16% below the November 2022 peak, but 28% above the 2020 trough).
*Note: real dollars are after adjusting for the effects of inflation each quarter.
October 2024
Previous updates.
2023