Auckland economic update March 2025
Author:
Ross WilsonSource:
Auckland Council Social and Economic Research and Evaluation TeamPublication date:
2025Topics:
EconomyAn overview of the Auckland economy for March 2025, in charts and graphs and with some commentary.
Measures covered: house prices and numbers sold, weekly rents, building consents, employment and unemployment, GDP, business and consumer confidence, retail sales, imports.
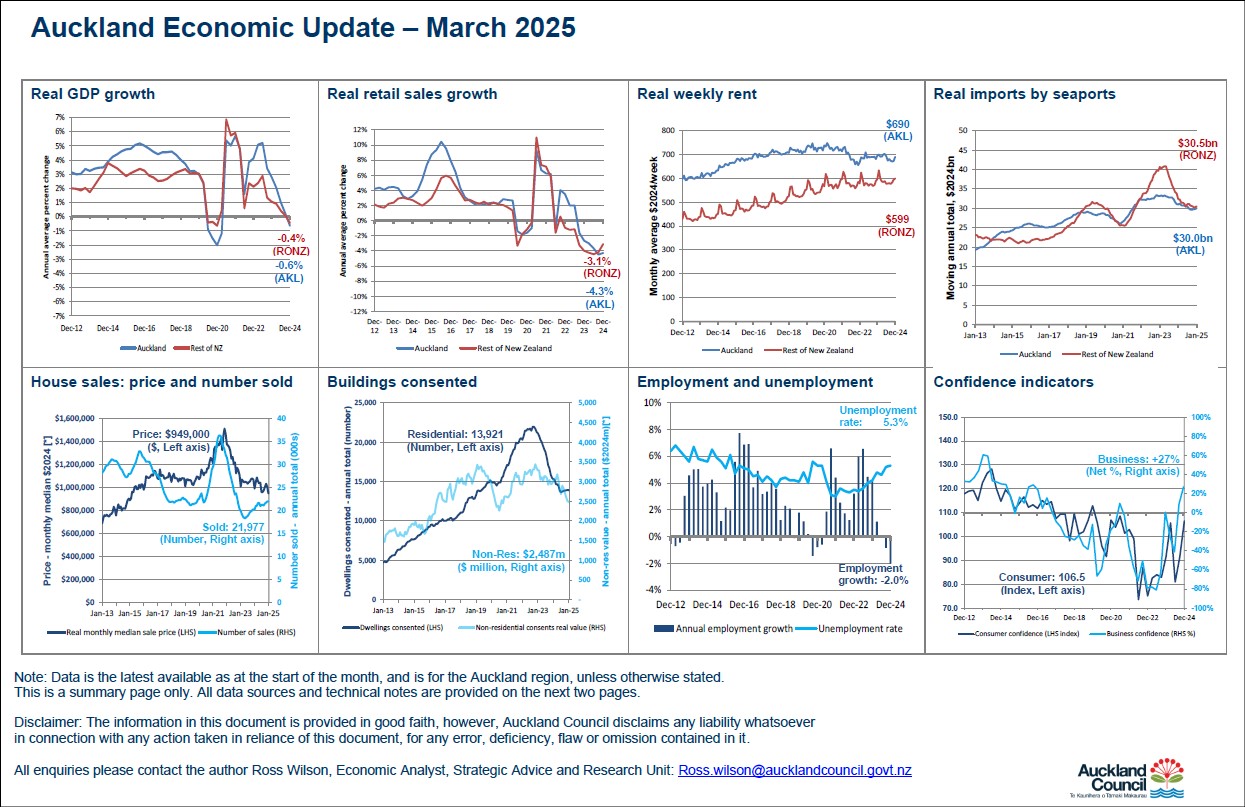
Highlights include:
- median house price for the month of January 2025 was $949,000 (in real* dollars: similar to nine years ago (2015/2016); 4% lower than a year ago; 6% below December ($1.01 million); 37% below the 2021 peak);
- number of houses sold for the year ended January 2025 was 21,977: 20% above the May 2023 trough, and rising continuously since September 2024, but still 40% below the July 2021 peak;
- average weekly rent for the month of December 2024 was $690 (in real* dollars: broadly similar to the last several months, e.g. 1% lower than a year ago; below most of the last eight years). For the rest of New Zealand, the figure was $599: rising due to seasonality; similar to a year ago, following over three years of minimal increases;
- number of new dwellings consented in the year ended January 2025 was 13,921: 37% lower than the September 2022 peak; 7% below the 2019/2020 pre-Covid peak five years ago; rising slowly since July 2024;
- real* value of new non-residential buildings consented in the year ended January 2025 was $2,487 million: 17% below a year earlier; below nearly all of the last four years, and 28% below the November 2022 peak, but 10% above the 2020 trough;
- number of people employed in the quarter ended December 2024 was 2.0% lower than in December 2023 quarter: the sixth quarter in a row of falling annual growth rates despite population growth;
- unemployment rate in the quarter ended December 2024 was 5.3%: the highest-equal quarter since the 2020 Covid lockdowns, and above most of 2017 to 2024, but still lower than 2009 to 2015 and late 2020;
- real* value of GDP for the year ended December 2024 was 0.6% lower than for the year ended December 2023; in the rest of New Zealand, the annual change was 0.4% fall (see notes). Both growth rates were: below most periods since 2010; falling since mid-2023; lower than recent population growth; nearly as low as the Covid-related trough of 2020; above the GFC-related trough of 2009;
- real* value of retail sales for the year ended December 2024 were 4.3% lower than for the year ended December 2023; in the rest of New Zealand, the annual change was a 3.1% fall. Both growth rates were among the lowest since 2009 (just after the Global Financial Crisis), even including the 2020 Covid lockdowns. Both growth rates have been generally falling since late 2022.
- real* value of imports by Auckland seaports for the year ended January 2025 was $30.0 billion, which was 3% lower than the year ended January 2024, but 15% higher than the 2020 Covid trough. For the rest of New Zealand, the figure was $30.5 billion: 6% lower than a year ago, and 25% lower than the 2023 post-Covid rebound peak. For most of 2024, import values for Auckland and the rest of New Zealand were similar, and both showed a slight downtrend;
*Note: real dollars/values are after adjusting for the effects of inflation each quarter, so a similar ‘real’ level means that a value rose at a similar rate to inflation.
March 2025
Previous updates.
2024